Worldsteel published December and full-year 2018 world crude steel production today. World crude steel production was 147.1 million metric tonnes in December, 4.2% higher than in December 2017. Full-year 2018 production was 1,808.6 million tonnes, 4.6% higher than in 2017.
Chinese crude production accounted for 51% of full-year 2018 world output and showed a 6.6% increase between 2017 and 2018, accounting for 73% of the rise in production year-on-year. Asian output outside of China grew 3.2% supported by increases in India (+4.9%), Vietnam (+36.9%), and South Korea (+2.0%). European Union production fell 0.2% over the same period and North American output was up 4.1%, driven by a 6.2% increase in the US and despite a 4.0% drop in Canada. Other significant production gains around the world came from Iran (+17.7%) and Egypt (+13.6%).
All the data for 2018 and for a number of prior years can be found in the downloadable spreadsheet below. Note that annual totals may not match the sum of the months because the annual data includes estimates of countries which only report annually.
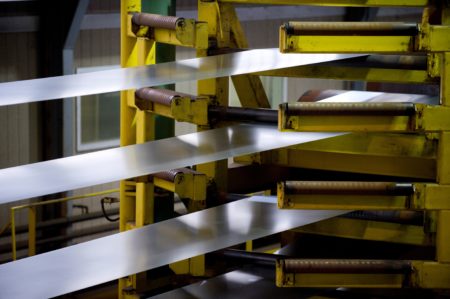
 Rolling process at NLMK Pennsylvania (NLMK Group)
Photo from Worldsteel Association Image Library by Worldsteel / Jeff Swensen, Image ID: 467
Worldsteel reported Chinese crude steel production at 77.6 million metric tonnes in November, 10.8% higher than in November 2017. Chinese output over the first eleven months of 2018 was 6.8% higher than in the same period last year.
Chinese net finished steel exports (exports minus imports) in November were 4.2 million tonnes, 0.2% lower than in November 2017. Net exports in the first eleven months of 2018 were 10.3% lower than in the first eleven months of 2017.
China monthly crude steel production
January 2006 to November 2018, thousand metric tonnes

Rails ready for transportation
Photo from Worldsteel Association image library by worldsteel / Shawn Koh, image ID: 752
Worldsteel published November’s world crude steel production yesterday. World steel output was 148.6 million metric tonnes, 5.8% higher than in November 2017. Crude steel production in the first eleven months of 2018 was 4.7% higher than in the same period last year.
China accounted for 52% of world output in November with production of 77.6 million tonnes, 10.8% higher than in November 2017. Asian output outside of China grew 0.6% with increases in Taiwan (+8.4%) and Vietnam (+32.2%) offsetting declines in Pakistan (-29.5%) and India (-1.3%). European Union production rose 1.2% on November 2017 and in North America, production rose 11.8% in the US, but was down 8.2% in Mexico and 4.1% in Canada. Other notable changes year-on-year include a 4.0% decline in Russia, a 11.2% drop in Ukraine, and a 6.1% fall in Brazil.

Tapping molten iron in blast furnace ironmaking plant
Photo from Worldsteel Association image library by worldsteel / Seong Joon Cho, image ID: 251
Based on reported import licenses, US long steel products imports rose 24% from 198,000 short tons in October to 246,000 tons in November. The increase is mainly the result of higher wire rod imports from Germany, Venezuela, and Australia.
Based on January to October imports and November licenses, long products imports in the first eleven months of 2018 were 26% lower than in the same period last year with the largest volume declines coming from wire rod, down 25% and rebar, down 23%.
SIMA US long products imports licenses
2012 to 2018
short tons

Photo by Steel Construction [Public domain], da Wikimedia Commons
Based on reported import licenses, US flat steel products imports fell 18% from 893,000 short tons in October to 733,000 tons in November. While imports of all flat products categories fell, most of the decline was due to lower hot roll imports from South Korea, Canada and Egypt, as well as lower hot dip galvanized imports from South Africa, Turkey, Vietnam, and the United Arab Emirates.
Based on January to October imports and November licenses, flat products imports for the first eleven months of 2018 were 5% lower than in the same period last year with a rise in hot roll imports (+18%) offsetting a decline in cold roll (-24%), hot dip galvanized (-12%), and cut plate imports (-21%).
SIMA US flat products import licenses
January 2013 to November 2018
short tons

Photo by the Theis Group [CC BY-SA 3.0 (https://creativecommons.org/licenses/by-sa/3.0)], from Wikimedia Commons
All you purchasers, traders, shippers and Nerds. If you really want to know what’s happening on 2/3 of the earth’s surface, you need to check Marine Traffic out. Get the full story…
Read more at Marine Traffic
 Rolling process at NLMK Pennsylvania (NLMK Group)


